· Updated · No. 209
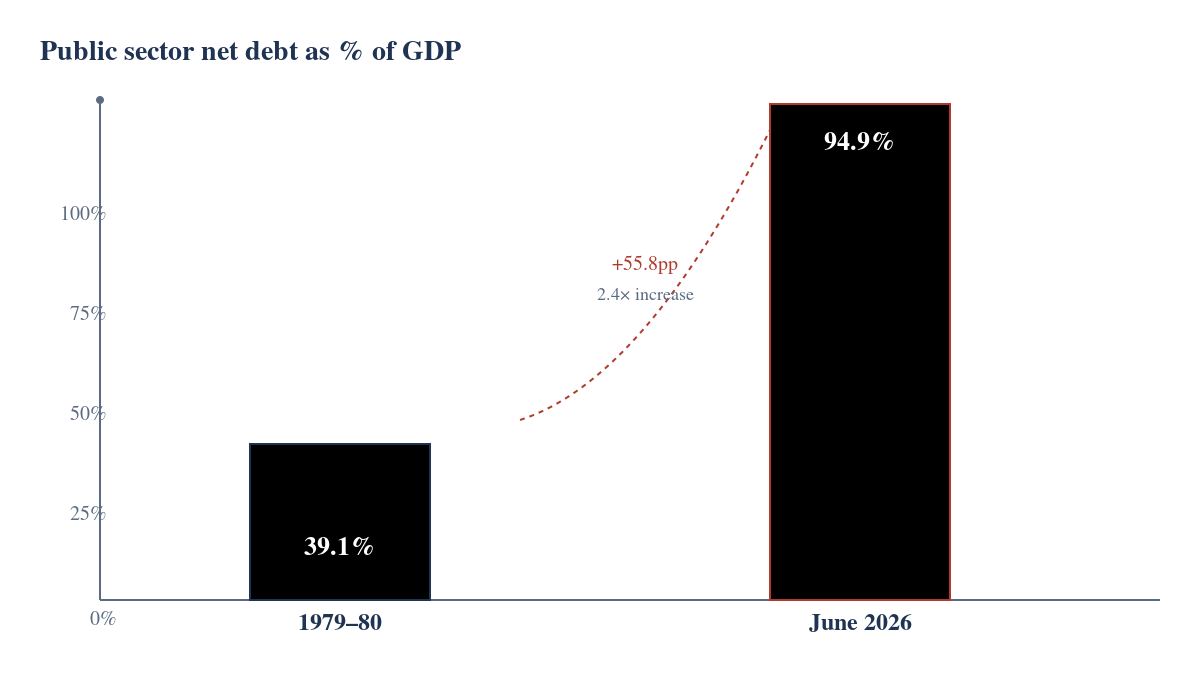
UK national debt has risen from 39% of GDP in 1979 to 95% in 2026, driven by recessions, the financial crisis, the pandemic and ongoing spending deficits.
UK national debt: 1979 compared with today
The UK's national debt is now substantially higher relative to the size of the economy than it was when Margaret Thatcher became Prime Minister in 1979.
Using public sector net debt as a percentage of GDP gives us a more meaningful comparison than simply comparing the cash amounts.
The comparison
| Measure | 1979-80 | June 2026 |
|---|---|---|
| Public sector net debt (% of GDP) | 39.1% | 94.9% |
| Debt in cash terms | Much lower | £2.99 trillion |
| Debt relative to the economy | About 39p per £1 of GDP | About 95p per £1 of GDP |
The 1979-80 figure is from the historical figures discussed earlier. The June 2026 figure is the latest available in the official statistics I found.
The debt-to-GDP ratio has risen by approximately 56 percentage points. Today's ratio is about 2.4 times the 1979-80 level.
This does not mean the government owes 95% of its annual tax revenue. GDP measures the value of the whole economy, not government income.
What caused the increase?
Several major events contributed to the increase in public debt over the intervening decades:
The early 1990s recession: Weaker tax receipts and higher spending increased pressure on public finances.
The 2008 financial crisis: The recession reduced tax revenues, while government support for the financial system and economic recovery added to the financial burden.
The COVID-19 pandemic: Government spending on business support, furlough and public services increased borrowing substantially.
More recent borrowing: Public spending has continued to exceed revenue, adding to the accumulated debt.
The relative importance of these factors varies by period.
What does this mean for the government?
A higher debt burden can mean:
More interest payments: The government must devote money to servicing its debt.
Less room for manoeuvre: Higher borrowing costs can make it harder to respond to economic crises.
Greater sensitivity to interest rates: Changes in borrowing costs can have a significant effect on public finances.
However, a high debt-to-GDP ratio does not automatically mean a country is unable to manage its debt. Interest rates, economic growth, tax revenues and the structure of the debt all matter.
How does this relate to privatisation?
This brings us back to your earlier question.
The Thatcher government sold state-owned businesses partly to raise money and reduce the state's involvement in industry.
But the sale of public assets did not prevent national debt from rising over the following decades.
There is an important distinction between selling an asset to raise money and reducing the underlying gap between government income and expenditure.
The UK can sell assets and still accumulate debt if its spending exceeds its revenue.
Bottom line
In 1979-80, public sector net debt was around 39% of GDP. By June 2026, it had reached 94.9% of GDP, or approximately £2.99 trillion.
The UK is therefore carrying a much larger debt burden relative to the size of its economy than it was at the beginning of the Thatcher era.

Comments
No answered comments yet. Yours could be the first.
Add a comment
Your email address is needed so we can reply, and is never shown on the site. Comments appear here once they have been answered.